Changelog
Follow up on the latest improvements and updates.
RSS
You can now build automated workflows based on Stripe payment events — allowing you to respond instantly when a payment fails or succeeds.

**🔌 Stripe Integration Required**
Be sure to connect your Stripe account in GoCSM to enable these triggers.
🆕 What’s New
✅
Payment Success Trigger
- Automatically run workflows when a payment is successful
- Great for tagging users, sending notifications, or updating subscription stages
❌
Payment Failed Trigger
Trigger workflows when a payment fails to:
🔖 Tag the customer as payment failed
📍 Move them to the “Subscription Payment Failed” stage inside the Subscription + Billing Pipeline
🚫 Pause services or notify your team
🔁 Auto-Recovery Logic Included
If a customer later successfully pays, GoCSM will:
✅ Remove the payment failed tag
🔄 Move them back to the “Active Subscription” stage in your pipeline
💡 Use Cases
🧠
Automated Dunning Sequences:
Send reminders or retry payment links right after a failed attempt.🔁
Subscription Recovery Flows:
Bring customers back to “Active” automatically after a successful payment.📬
Instant Notifications:
Notify internal teams on real-time events.These triggers are now live under Workflows > Triggers > GoCSM Triggers.
Need help setting up your automation? Join a support session or check out our Help Docs.
We’ve just rolled out a powerful update to how churned accounts are handled in GoCSM — helping you keep your system clean and your automations accurate.
🆕 What’s New
When a SaaS Company is marked as “Churned” (i.e., canceled their subscription):
- ✅ All users under that company are now automatically tagged as Churned
- 🚫 Churned users are also removed from all active Workflows and Pipelines
💡 Why This Matters
- 🧹Cleaner Automation Flows:Prevent churned users from receiving irrelevant emails or offers.
- 📊 Better Reporting:Ensure segmentation and metrics reflect actual customer status.
- 🔄 Streamlined Retention Strategy:Focus your CSM efforts only on active users while optionally creating separate win-back workflows for churned ones.
This logic is now live and requires no setup.
Churned Companies
= SaaS customers who’ve canceled→ All associated users =
Tagged
Churned
+ Removed from Pipelines & Workflows
new
Dashboard
Product Adoption
Health
Login Activity & Time Spent on Features Trend Charts Now Live!
We’ve added two powerful new trend charts to your GoCSM Dashboard — giving you visual insights into user activity and feature engagement over time.
These dynamic charts help you monitor platform usage patterns and spot changes before they impact retention.
🆕 What’s New
📊 Login Activity Trend

- A clear line chart showing monthly or weekly login behavior.
- Tracks Active vs. Inactive users over time, helping you spot drop-offs or spikes in platform engagement.
🕒 Time Spent on Features Trend

- Line chart showing how many minutes are spent per feature, over time.
- View by Month or Week for detailed analysis.
- You can include/exclude specific features to focus on what matters most to your strategy.
💡 Use Cases
🧠
Customer Health Monitoring:
Quickly identify engagement drops and re-engage accounts before churn happens.📅
Seasonality & Behavior Trends:
Discover usage spikes tied to campaigns, updates, or time of year.⚙️
Team or Feature Impact:
Correlate time spent with success initiatives or product updates.These charts are now available in your GoCSM Dashboard.
Flip between Monthly or Weekly views and tailor the data to fit your analysis needs.
Need help using the filters or analyzing the trends? Join a support session or check the Help Docs.
new
Dashboard
Product Adoption
📊 New Product Adoption by Companies & Users Charts Are Here!
We’ve just launched brand-new visual insights to help you track how your platform is being used — by both companies and users.
Introducing the New Product Adoption Charts — now available inside your GoCSM Dashboard!
🆕
What’s New🔹 Product Adoption by Companies

- Displays the total number of companies actively using each feature.
- Only includes companies that have spent at least 1 hour in the feature — giving you clean, meaningful data.
- Click on any bar to instantly view a list of companies using that feature.
🔹 Product Adoption by Users

- Tracks how many individual users are engaging with each feature.
- You can now link each bar to a Smart List — clicking the bar will redirect you to a filtered contact list based on feature usage.
- Great for segmenting users by activity level!
💡 Use Cases
🎯
Spot High-Value Features:
See which features your users love — and which need more attention.💬
Trigger Smart Campaigns:
Build automations or outreach workflows based on real usage data.🧪
Test and Measure Adoption:
Launch new features, then monitor real-time user interaction.This new chart section is now live for all GoCSM users.
Check it out in your dashboard and start turning data into action.
Need help? Join our support session or submit a ticket.
improved
Feedback (NPS)
💬 Feedback Comments Now Saved to Custom Field
You asked, we delivered!
Feedback comments submitted via the GoCSM Feedback Widget are now automatically saved to a Custom Field on the contact record.

🆕
What’s New
Every time a user submits a feedback comment, it’s now stored in a dedicated custom field.
This enables you to:
🔁 Send feedback data to third-party apps like Slack, Zapier, or CRMs.
🔔 Create detailed notifications for your team with the actual comment included.
📂 Keep a historical record of what your users are saying — all in one place.
💡
Use Cases
🚨
Instant Slack Alerts:
Trigger real-time Slack messages with user comments when feedback is received.🤝
Sales & Support Alignment:
Push detailed feedback into your CRM or Helpdesk tools for better customer context.📊
Feedback Reporting:
Use the custom field for advanced segmentation and reporting inside your workflows.This enhancement is live now — no extra setup required!
improved
Product Adoption
🕒 Update: Time Spent Now Tracks Only Active Window Usage
We’ve made a key improvement to how Time Spent Tracking works in GoCSM — ensuring more accurate reporting of real user engagement.
🛠️ What’s Improved
Previously, GoCSM tracked time as long as a feature or tab was open — even if the user wasn’t actively interacting with it. This meant you might see inflated usage data if someone left a tab open and walked away.
✅ What’s New
Time is now tracked only when the GoCSM feature window is active.
If a user switches tabs, minimizes the window, or walks away without interacting, the clock pauses — giving you a much clearer picture of how much time is truly spent using your platform.
🔍 Why This Matters
🧠
Better Usage Insights
Accurately see which features your users are really spending time on — not just what they left open.
🎯
Smarter Product Decisions
Use precise engagement metrics to prioritize feature improvements based on actual usage, not idle time.
📊
Reliable Reporting
Your dashboards and reports now reflect active user behavior, leading to more trustworthy data for your Customer Success and Product teams.
💡 Use Cases
- Feature Adoption Tracking:Know which tools are being used with intent, not just opened out of curiosity.
- Customer Success Evaluation:Better understand how your clients interact with the platform during onboarding or support sessions.
- Client Activity Monitoring:Filter out passive time and focus on meaningful engagement.
This fix is now live across all GoCSM dashboards.
📩 Questions or feedback? Let us know below or book a support session.
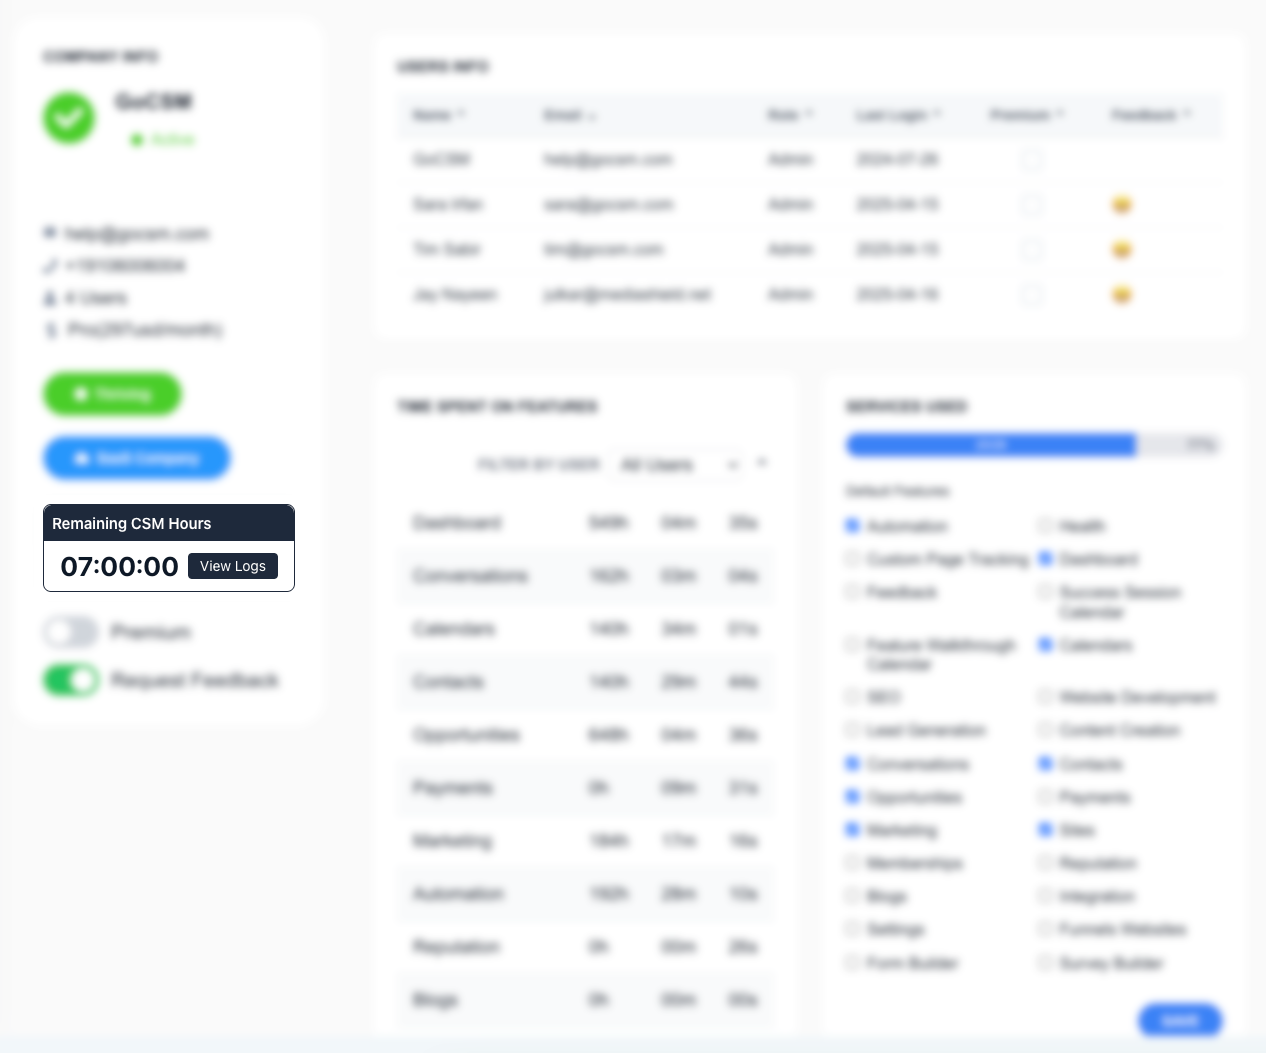
We’re excited to launch CSM Hours, a powerful new feature that lets you set and track the number of Customer Success Manager hours allocated to each customer — based on their plan or subscription level.
This is perfect for agencies and SaaS businesses that offer hands-on support, onboarding, or consulting time as part of their pricing tiers. Now, you can measure the actual time your CSMs spend per account and manage that resource more efficiently.
🔧 How It Works
Integrate Stripe
Make sure your Stripe account is connected to GoCSM so we can match customers to their active plan.
1
. Configure CSM Hours Per Plan
Go to Plans Configuration inside your GoCSM dashboard. For each SaaS or service plan, set the number of monthly CSM Hours that come with it.
- Enable the GoCSM Widget
Once enabled, your CSMs will have access to the widget where they can start/stop tracking time directly while working on a customer’s account.
- Track Hours in Real-Time
CSMs can see how many hours are remaining per client and log their activities within the widget — making time management seamless.
4. Monitor in the Company Health Profile
Inside the Company view under Health, you'll see:
- Total CSM Hours allocated
- Hours used
- Logged activities by your team
💡 Use Cases
- Plan-Based Support:Offer more personalized time to premium clients and limit time usage for trial or basic-tier users.
- Onboarding Services:Track hours spent onboarding each client and keep your team accountable.
- Account Reviews or Strategy Calls:Easily manage time spent on strategy sessions or check-ins.
- Internal Resource Planning:Know exactly where your CSM team’s time is going so you can optimize staffing and support load.
✅ Why It Matters
📊
Clarity on Time Spent
– Know which clients are taking the most CSM time and whether it aligns with their value to your business.🔄
Transparent Client Communication
– You can show customers how much time they’ve used and what it was used for.💸
Better ROI Per Plan
– Ensure your service time scales appropriately with what clients pay for.📅
Operational Control
– Keep your CS efforts organized and trackable, without needing separate tools.The CSM Hours feature is now live for all GoCSM users.
Try it out today and start maximizing your team's efficiency!
new
Feedback (NPS)
🌟 New Enhancement: Feedback Customization is Here!
Collecting feedback just got a major upgrade.
With the new Feedback Customization features in GoCSM, you now have full control over the look, feel, and behavior of your Request Feedback Widget — so it perfectly matches your brand and strategy.
Whether you're collecting feedback in-app or on your client portal, this enhancement gives you the flexibility to make every touchpoint feel personalized and purposeful.

🆕 What’s New
You can now customize the Feedback Widget by:
🎨
Changing the Widget Button Color
Match it to your brand or platform theme for a seamless experience.
😃
Choosing Stars or Emojis
Set the tone of your feedback request — go classic with stars or casual with emojis.
✍️
Custom Headlines & Thank You Messages
Write your own feedback prompt and thank your users in your brand voice.
🔗
Linking Google or Facebook Review Pages
Automatically redirect satisfied users to leave a public review — boosting your reputation where it matters most.
💼 Use Cases
Brand Consistency:
Agencies and SaaS platforms can ensure their feedback request matches the branding of their dashboard or app.Public Review Collection:
Use positive internal feedback as a launchpad to grow your Google or Facebook reviews.Tone Control:
Choose emojis for a light and friendly experience, or stars for a more structured one — depending on your audience.Multilingual Messaging:
Write the widget content in any language to localize the experience for different regions or client types.✅ Why This Matters
🔁
Higher Engagement:
A branded and friendly widget is more likely to get clicked — which means more feedback from your customers.🌍
Boost Public Reputation:
With direct links to Google and Facebook reviews, you can turn internal wins into public testimonials.🧠
Informed Strategy:
Tailored feedback messages let you guide customers into giving actionable, relevant responses.🚀 Getting Started
Go to your Feedback (NPS) > Customize
Adjust the color, rating type, and custom messages
Add your Google or Facebook review links
Enable the Request Feedback in Health
Start collecting feedback that feels like you
This update is now available for all GoCSM users.
Need help configuring it? Check the Help Docs or join a support session.
This new feature is all about giving you deeper insights into how your customers are interacting with your service. Here’s what you can expect:
- Customer Satisfaction Levels: Get a clear view of how happy your customers are.
- Features Usage:See which features are getting the most love.
- Login Frequency:Understand how often your customers are engaging with your platform.
- Health Points:Assess the overall 'health' or loyalty status of your customers based on their interactions.
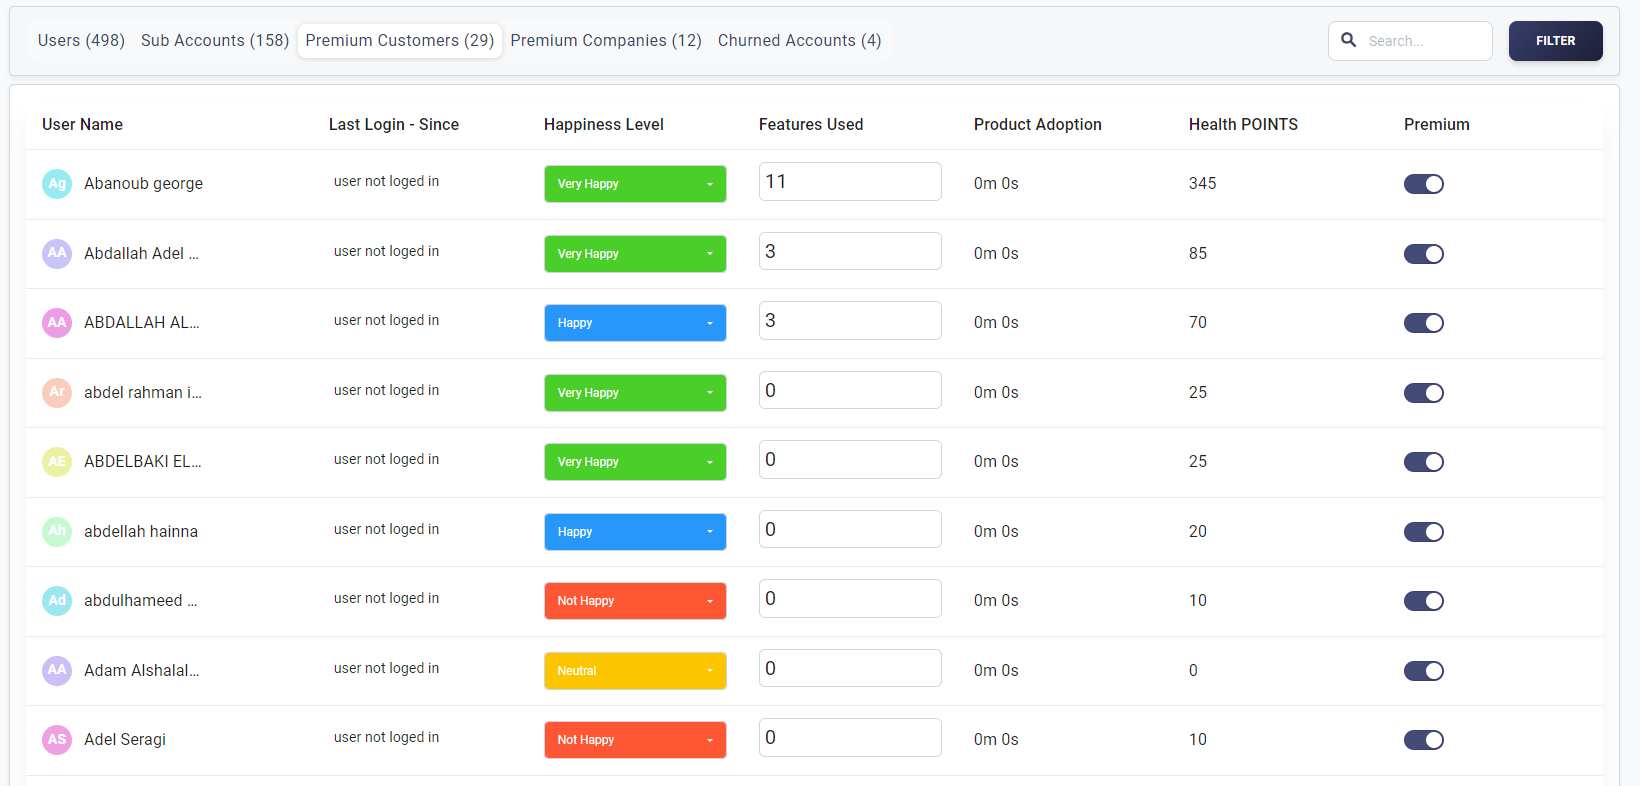
This feature aims to empower you with insights to enhance customer satisfaction and retention. Dive in and explore these metrics to better understand your customer base!
new
Dashboard
Introducing the Eagle-view Dashboard
Hey everyone! We're excited to roll out our new Eagle-view Dashboard. This tool is designed to give you a bird’s-eye view of your entire client base. Here’s what you can look forward to:
- Overview of Your Clients:See all your clients in one place and get a clear picture of the landscape.
- Key Metrics Tracking:Easily track key metrics like engagement levels, activity stats, and more.
- Churn Risk Identification:Spot potential churn risks before they become issues with our predictive insights.
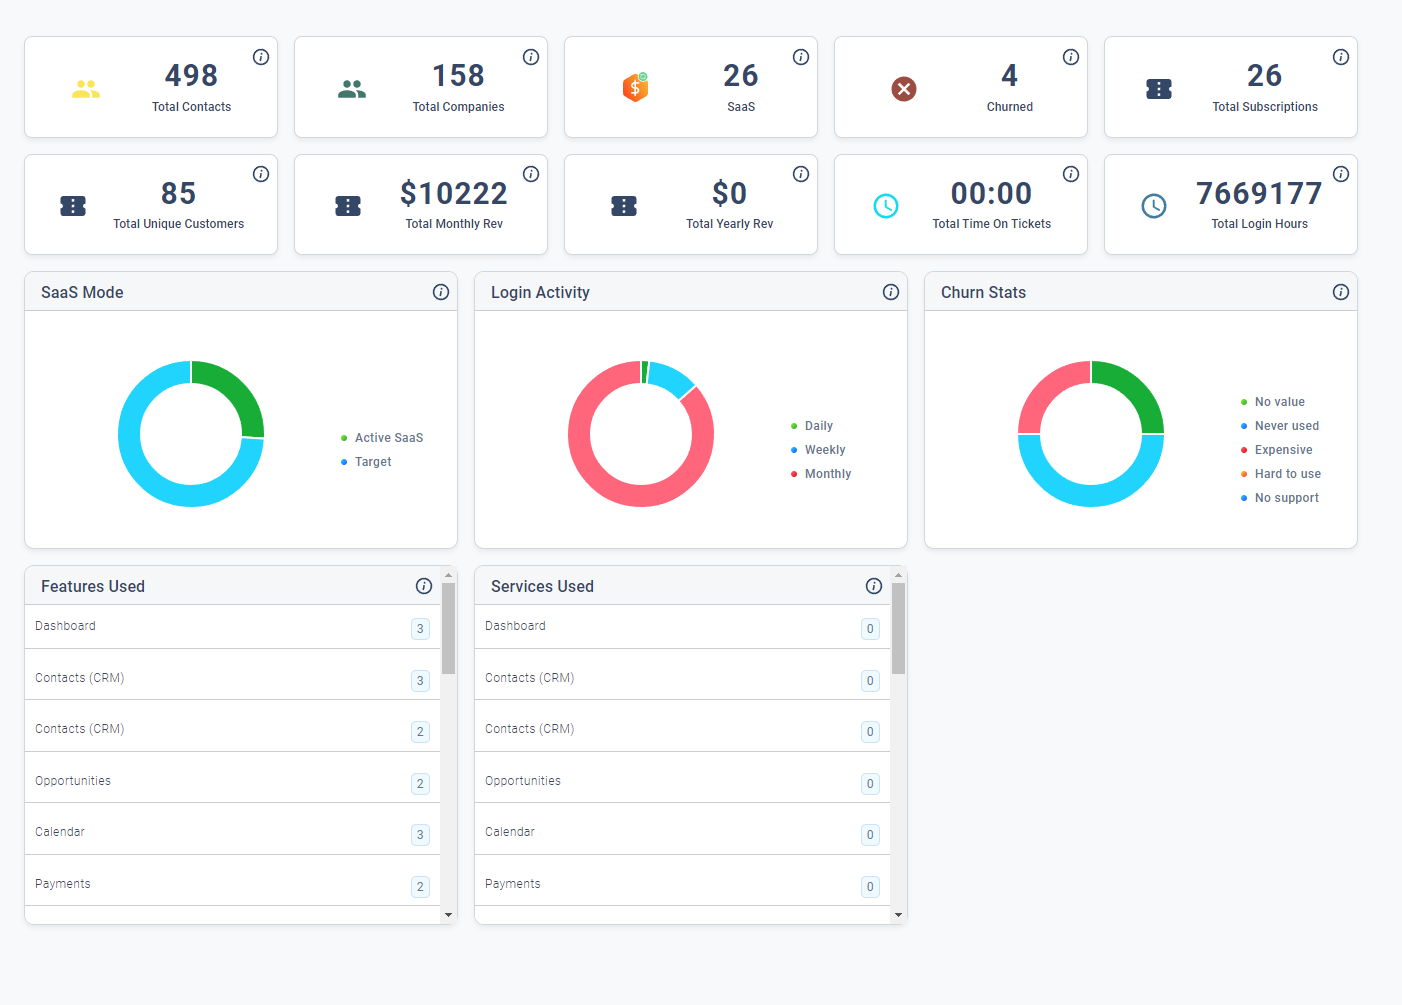
This dashboard is all about making your life easier and helping you stay two steps ahead. Check it out and let us know how it works for you!
Load More
→